The Problem
Insurance teams face significant challenges from fragmented claims data across P&C, life, and health systems, hindering timely volume, severity, and reserve forecasts essential for premium setting and solvency.
This fragmentation across legacy policy administration, claims platforms, and actuarial databases creates reconciliation burdens, exacerbated by regulatory requirements like IFRS 17's insurance contract measurement (including contractual service margin tracking) and Solvency II's solvency capital requirement (SCR) modeling, alongside NAIC risk-based capital guidelines, risking non-compliance and forecast inaccuracies.
Current solutions rely on manual aggregation or siloed predictive analytics, failing to unify disparate sources effectively or meet regulatory audit needs, despite AI advances in isolated claims processing that achieve gains like 23-day reductions in complex assessments but lack cross-system integration.
Our Approach
Key elements of this implementation
-
Federated ML aggregation with semantic mapping for Guidewire, Duck Creek, CCS ClaimCenter, and actuarial DBs, building compliant unified data layer with data residency zoning (EU/US/Asia)
-
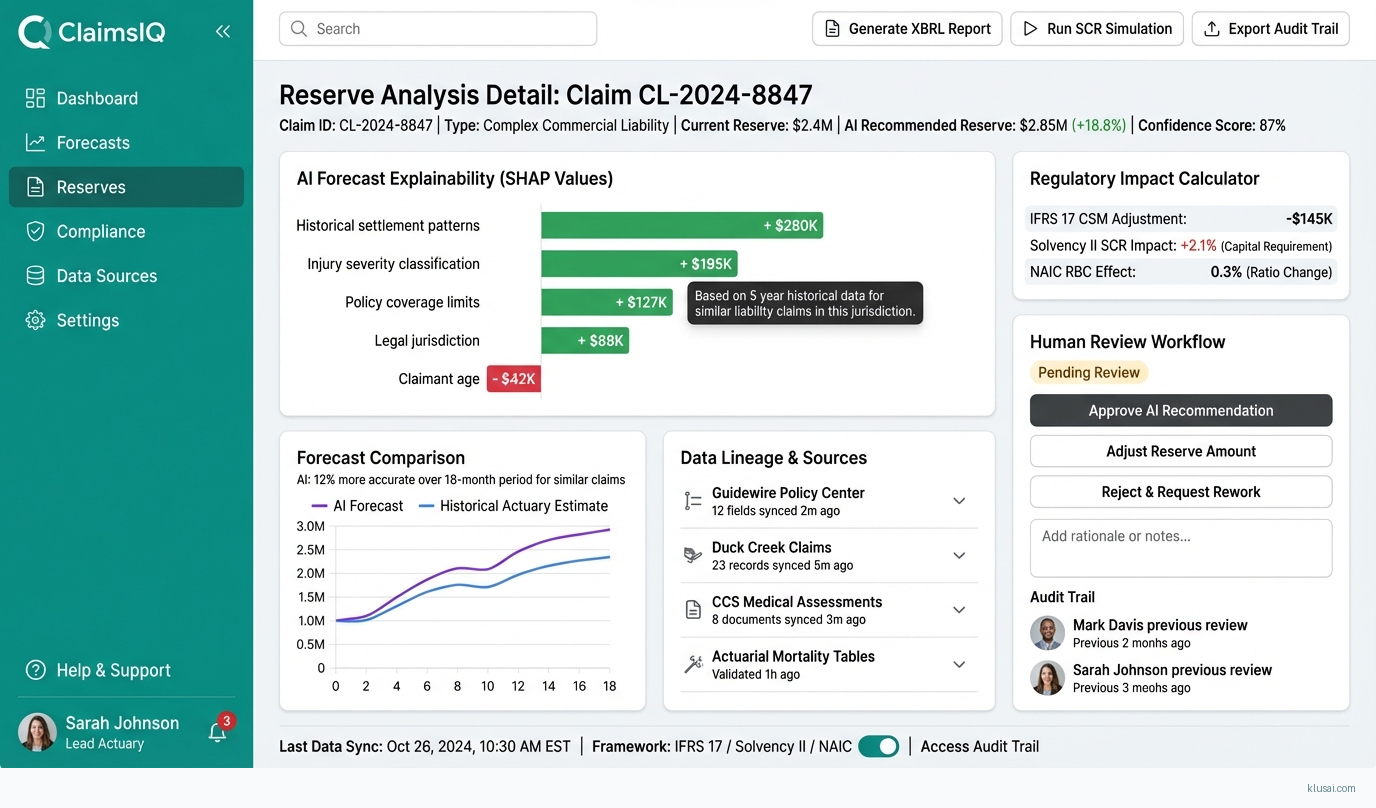
Built-in IFRS 17 CSM tracking, Solvency II SCR simulations, NAIC RBC modeling with full audit trails via tamper-proof logging (no blockchain), explainable AI (SHAP) for 12-month forecasts
-
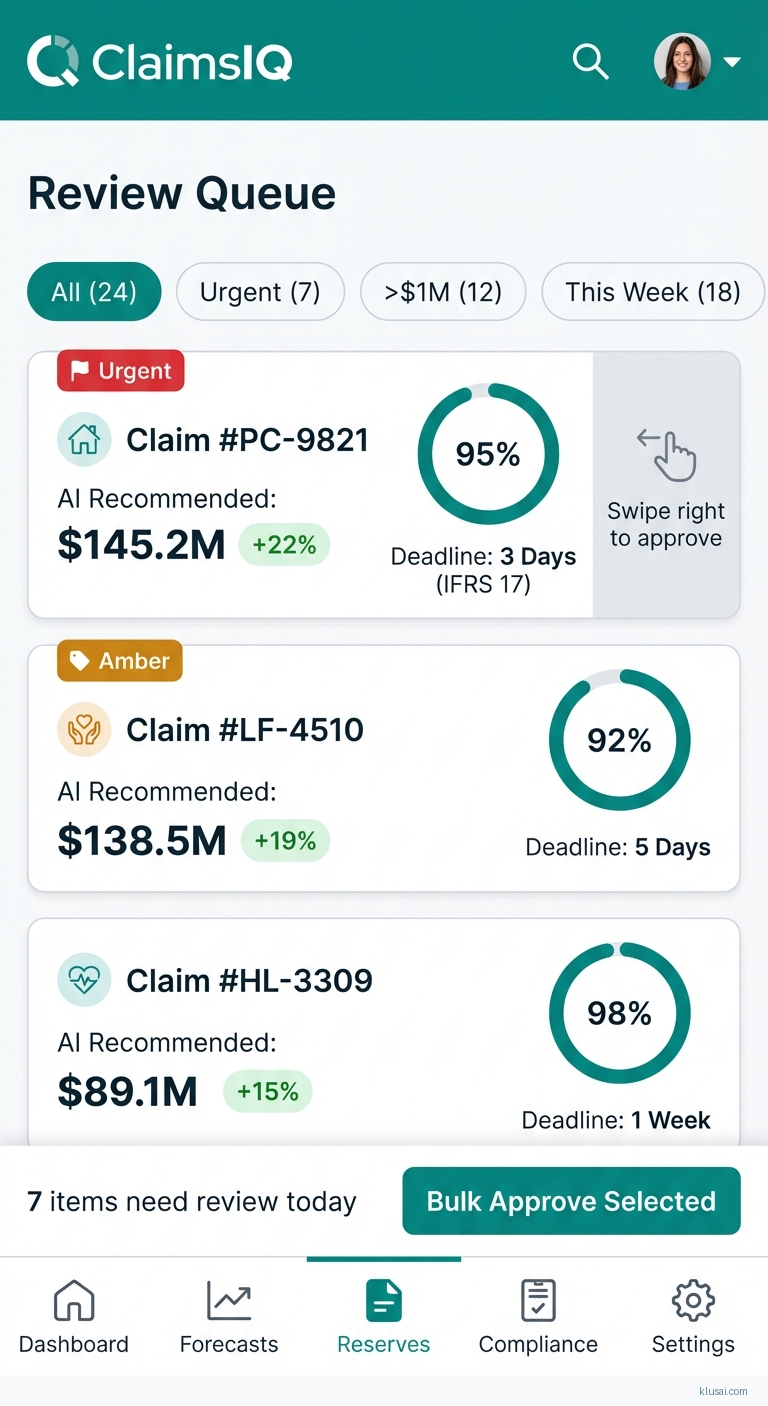
Human-in-loop review for reserves >$1M, automated XBRL/JSON regulatory reporting, pre-ingestion data validation addressing quality risks
-
Phased rollout (pilot one line, 60-day parallel run with 20% timeline buffer), 2-week exec training, change champions for adoption amid integration challenges
Get the Full Implementation Guide
Unlock full details including architecture and implementation
Implementation Overview
This implementation establishes a federated machine learning platform that unifies fragmented claims data across P&C, life, and health insurance systems while maintaining strict regulatory compliance with IFRS 17, Solvency II, and NAIC RBC requirements. The architecture addresses the core challenge that claims managers face: anticipating future outcomes based on past events while mining multiple data sources under significant workloads[2]. Rather than replacing existing policy administration and claims platforms, the solution creates a semantic integration layer that preserves data residency requirements across EU, US, and Asian jurisdictions.
The platform leverages federated ML aggregation to connect Guidewire, Duck Creek, CCS ClaimCenter, and actuarial databases without requiring data centralization, addressing both regulatory data residency requirements and the practical reality that insurers operate heterogeneous technology estates. Predictive analytics powered by AI enables insurers to analyze vast datasets from diverse sources[3], while built-in explainability through SHAP values ensures that 12-month forecasts meet regulatory audit requirements. The architecture incorporates tamper-proof logging for full audit trails and automated XBRL/JSON regulatory reporting to streamline compliance workflows.
Key architectural decisions prioritize regulatory compliance and operational resilience over pure performance optimization. Human-in-loop review gates for reserves exceeding $1M ensure appropriate oversight for material decisions, while pre-ingestion data validation addresses the quality risks inherent in aggregating disparate legacy systems. The phased rollout approach—piloting with one line of business, running 60-day parallel operations with 20% timeline buffer—reflects lessons learned from complex insurance technology transformations and mitigates integration risks.
UI Mockups
System Architecture
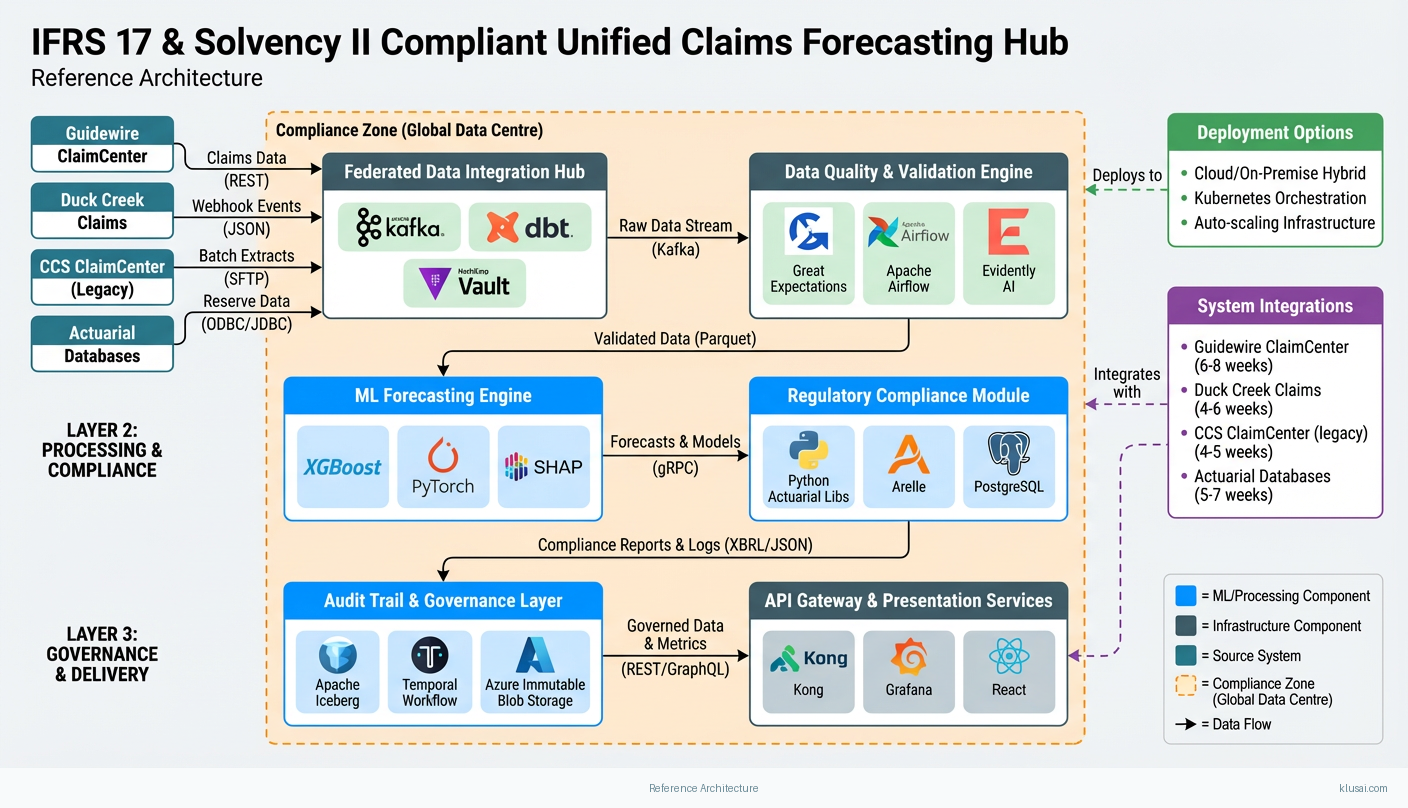
The architecture follows a four-layer design pattern: Data Integration Layer, Unified Analytics Layer, Regulatory Compliance Layer, and Presentation Layer. Data flows from source systems through federated connectors that apply semantic mapping without centralizing raw data, addressing both performance requirements and data residency regulations across global operations.
The Data Integration Layer deploys lightweight federated agents within each source system's security boundary (Guidewire, Duck Creek, CCS ClaimCenter, actuarial databases). These agents execute standardized queries and apply semantic normalization before transmitting aggregated, anonymized datasets to the central analytics platform. Data residency zoning ensures EU policyholder data remains within EU boundaries, US data within US infrastructure, and Asian data within appropriate regional facilities—critical for GDPR, state-level US privacy laws, and emerging Asian data protection regulations.
The Unified Analytics Layer hosts the ML forecasting models, trained on federated data representations rather than raw policyholder information. This layer generates volume forecasts, severity predictions, and reserve estimates with confidence intervals. SHAP-based explainability modules attach to each prediction, generating human-readable rationale that satisfies regulatory audit requirements. The layer maintains separate model instances for different lines of business while sharing learned representations where appropriate.
The Regulatory Compliance Layer implements IFRS 17 Contractual Service Margin (CSM) tracking, Solvency II Solvency Capital Requirement (SCR) simulations, and NAIC Risk-Based Capital modeling. Tamper-proof logging using append-only storage with cryptographic verification provides audit trails without blockchain complexity. Automated report generators produce XBRL and JSON outputs aligned with regulatory submission formats, reducing manual preparation effort significantly.
Key Components
| Component | Purpose | Technologies |
|---|---|---|
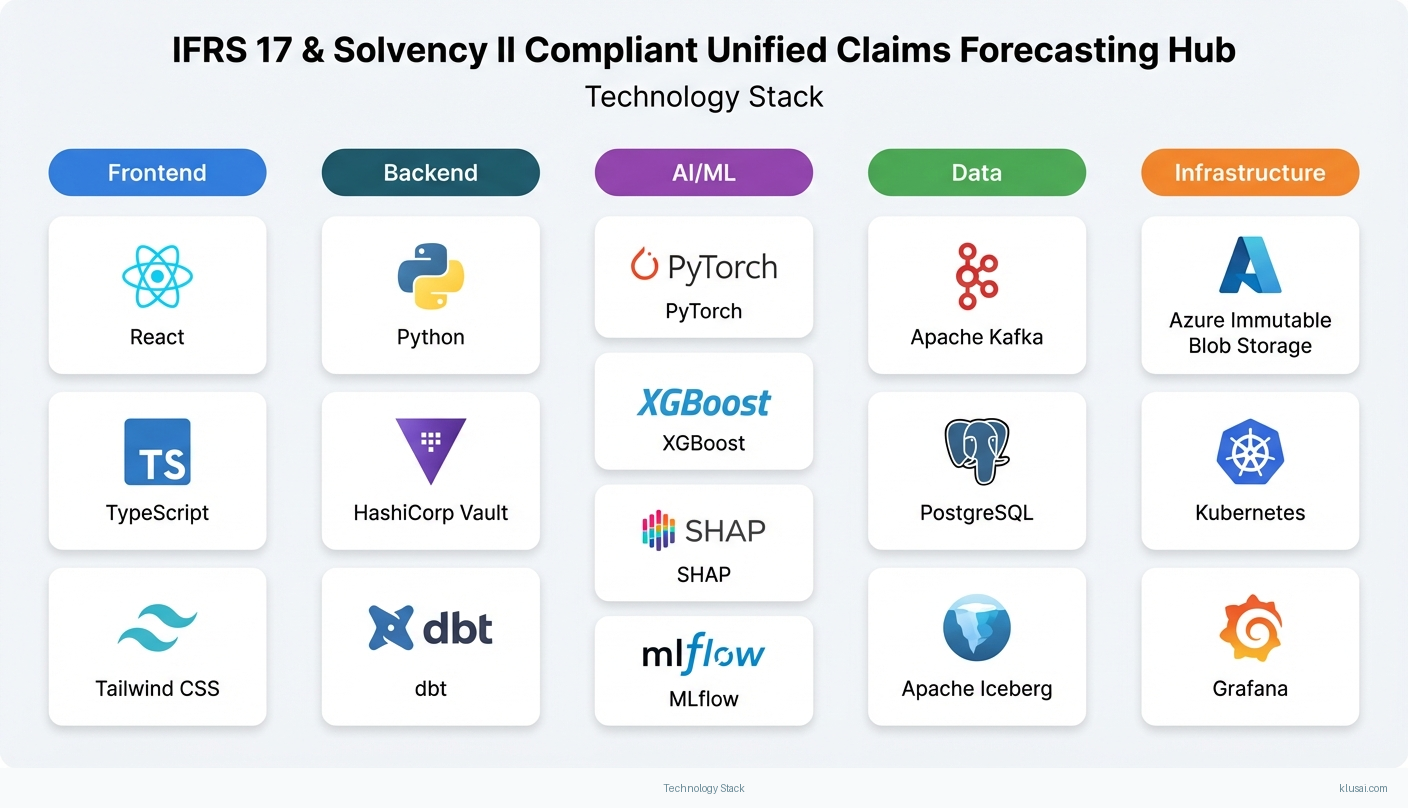
| Federated Data Integration Hub | Connects to Guidewire, Duck Creek, CCS ClaimCenter, and actuarial databases via lightweight agents, applying semantic mapping and data residency controls | Apache Kafka Dbt (Data Build Tool) Hashicorp Vault |
| ML Forecasting Engine | Generates 12-month volume, severity, and reserve forecasts using gradient boosting and neural network ensembles with SHAP explainability | Xgboost Pytorch Shap |
| Regulatory Compliance Module | Implements IFRS 17 CSM tracking, Solvency II SCR simulations, and NAIC RBC calculations with automated XBRL/JSON report generation | Python Actuarial Libraries Arelle Xbrl Processor Postgresql |
| Audit Trail & Governance Layer | Provides tamper-proof logging, data lineage tracking, and human-in-loop workflow management for high-value reserve decisions | Apache Iceberg Temporal Workflow Engine Azure Immutable Blob Storage |
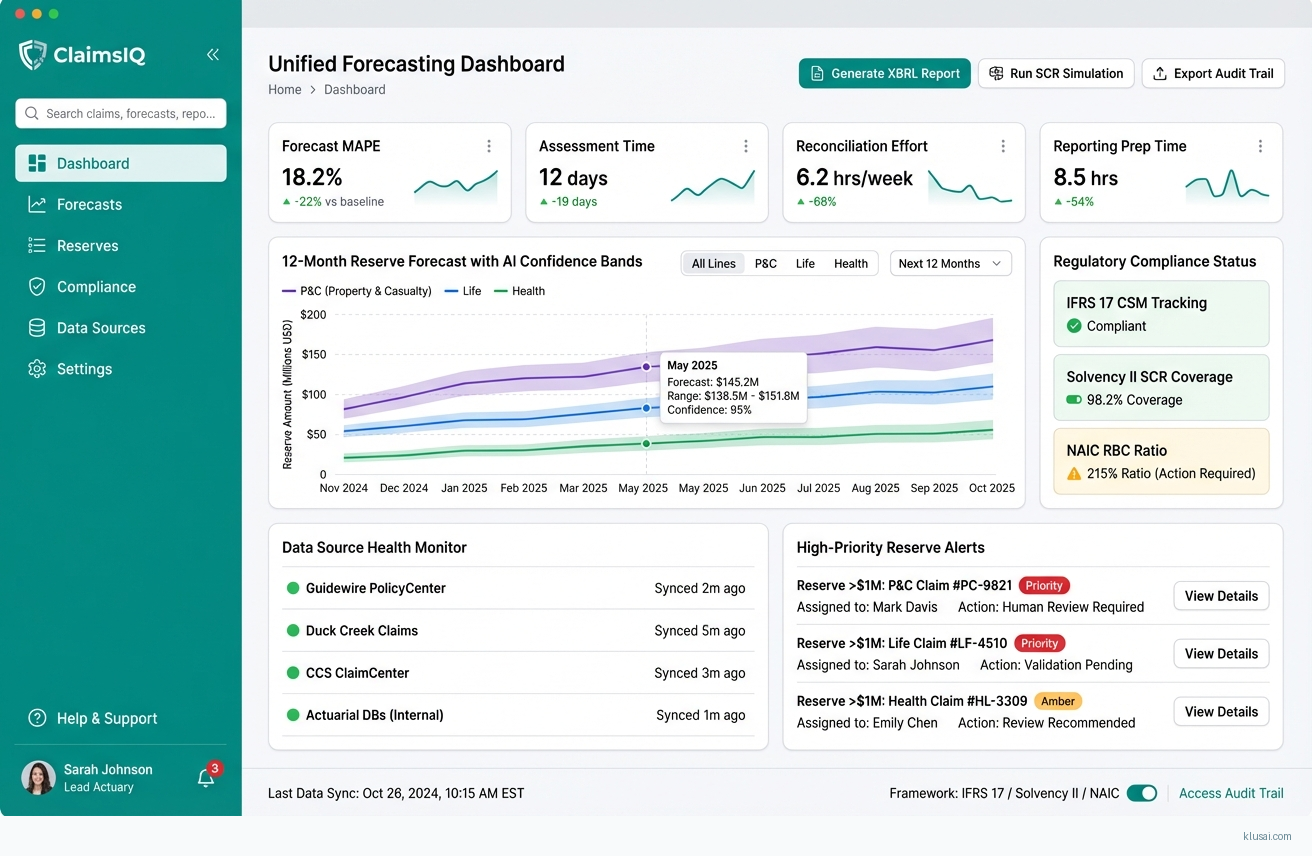
| API Gateway & Presentation Services | Exposes forecasting APIs to downstream systems and provides executive dashboards with drill-down capabilities | Kong Api Gateway Grafana React |
| Data Quality & Validation Engine | Pre-ingestion validation, anomaly detection, and data quality scoring to address risks from legacy system inconsistencies | Great Expectations Apache Airflow Evidently Ai |
Technology Stack
Implementation Phases
Foundation & Single Line Pilot
Establish federated connectivity to primary claims platform (Guidewire or Duck Creek) for one line of business
- • Establish federated connectivity to primary claims platform (Guidewire or Duck Creek) for one line of business
- • Deploy core ML forecasting models with SHAP explainability for volume and severity predictions
- • Implement basic IFRS 17 CSM tracking and audit logging infrastructure
- Federated data agent deployed and validated against one source system with semantic mapping
- Initial forecasting models generating 12-month predictions with confidence intervals and explainability reports
- Audit trail infrastructure with tamper-proof logging operational
Multi-System Integration & Regulatory Modules
Extend federated connectivity to remaining source systems (Duck Creek/Guidewire secondary, CCS ClaimCenter, actuarial databases)
- • Extend federated connectivity to remaining source systems (Duck Creek/Guidewire secondary, CCS ClaimCenter, actuarial databases)
- • Deploy Solvency II SCR simulation and NAIC RBC calculation modules with automated reporting
- • Implement human-in-loop review workflows for reserves exceeding $1M threshold
- All target source systems connected with validated semantic mappings and data residency controls
- Regulatory compliance modules generating XBRL/JSON reports aligned with submission formats
- Workflow engine operational with approval routing and escalation paths
Parallel Run & Validation
Execute 60-day parallel run comparing AI forecasts against existing actuarial processes
- • Execute 60-day parallel run comparing AI forecasts against existing actuarial processes
- • Validate regulatory report accuracy with compliance teams and external auditors
- • Complete executive training program and establish change champion network
- Parallel run analysis report documenting forecast accuracy, variance explanations, and improvement recommendations
- Regulatory compliance certification from internal audit with external validation
- Trained user base with documented procedures and escalation paths
Production Deployment & Optimization
Transition from parallel run to production operations with full organizational adoption
- • Transition from parallel run to production operations with full organizational adoption
- • Extend forecasting to additional lines of business based on pilot learnings
- • Establish ongoing model monitoring, retraining, and governance processes
- Production system operational with SLA monitoring and incident response procedures
- Expanded coverage to 2-3 additional lines of business with validated accuracy
- Model governance framework with scheduled retraining and drift detection
Key Technical Decisions
Should we centralize claims data or use federated learning approaches?
Data residency requirements across EU (GDPR), US (state privacy laws), and Asian jurisdictions make centralization legally complex and operationally risky. Federated approaches keep raw data within jurisdictional boundaries while enabling unified analytics through aggregated, anonymized representations. This also reduces data movement costs and latency for global operations.
- Maintains compliance with data residency regulations across all operating jurisdictions
- Reduces data transfer costs and latency for geographically distributed operations
- Increased architectural complexity requiring specialized federated ML expertise
- Some advanced analytics techniques may be constrained by federated data access patterns
How should we implement audit trail immutability—blockchain or alternative approaches?
Blockchain introduces unnecessary complexity, performance overhead, and operational burden for this use case. Append-only storage services (Azure Immutable Blob, AWS S3 Object Lock) provide equivalent tamper-evidence with cryptographic verification, integrate naturally with existing cloud infrastructure, and are well-understood by enterprise IT teams and auditors.
- Simpler operations and lower infrastructure costs than blockchain alternatives
- Native integration with cloud provider security and compliance certifications
- Relies on cloud provider trust model rather than distributed consensus
- May require additional documentation to satisfy auditors unfamiliar with immutable storage patterns
What explainability approach best balances regulatory requirements with operational usability?
SHAP provides theoretically grounded feature attribution that satisfies regulatory requirements for model explainability while remaining computationally tractable for production workloads. Hierarchical summarization presents executive-level explanations with drill-down capability to detailed feature contributions, serving both governance oversight and actuarial deep-dive needs.
- Theoretically sound methodology accepted by regulators and academic reviewers
- Consistent explanations across different model types in the ensemble
- Computational overhead for SHAP calculation on complex models requires GPU acceleration
- Explanations may be counterintuitive for non-technical stakeholders without training
How should human-in-loop review be implemented for high-value reserve decisions?
Reserves exceeding $1M require human oversight to manage regulatory and reputational risk, but rigid thresholds may not suit all lines of business. A configurable workflow engine allows threshold adjustment by business unit while maintaining audit trails. Temporal workflow engine provides durability guarantees ensuring no review request is lost during system failures.
- Flexible threshold configuration accommodates different risk appetites across business units
- Durable workflow execution prevents lost approvals during system failures
- Workflow configuration complexity requires careful governance to prevent threshold creep
- Human review latency may delay time-sensitive reserve decisions
Integration Patterns
| System | Approach | Complexity | Timeline |
|---|---|---|---|
| Guidewire ClaimCenter | Deploy federated agent using Guidewire Cloud API (REST) for real-time claim status and ClaimCenter Data Platform for batch historical extracts. Semantic mapping translates Guidewire's claim type taxonomy to unified schema. Agent runs within Guidewire's cloud boundary for data residency compliance. | high | 6-8 weeks |
| Duck Creek Claims | Integration via Duck Creek OnDemand APIs with event-driven sync using Duck Creek's webhook capabilities. Federated agent deployed as Duck Creek extension to maintain data residency. Mapping layer handles Duck Creek's flexible schema configurations. | medium | 4-6 weeks |
| CCS ClaimCenter (legacy) | Batch file extraction via SFTP with scheduled pulls from CCS reporting database. Semantic mapping handles legacy code tables and date formats. Data quality validation layer addresses known CCS data consistency issues. | medium | 4-5 weeks |
| Actuarial Databases (various) | Direct database connectivity via read replicas where available; ODBC/JDBC connections for legacy actuarial systems. Semantic layer maps actuarial reserve triangles and loss development factors to unified schema. Scheduled sync aligned with actuarial closing calendars. | high | 5-7 weeks |
ROI Framework
ROI derives from three primary value streams: reduced manual effort in claims data reconciliation and forecast preparation, improved reserve accuracy reducing capital buffer requirements, and accelerated regulatory reporting reducing compliance overhead. The 23-day reduction in complex liability assessments demonstrated by Aviva[5] provides a benchmark for efficiency gains achievable through AI-powered claims analytics.
Key Variables
Example Calculation
Build vs. Buy Analysis
Internal Build Effort
Internal build requires 18-24 months with a team of 8-12 specialists including ML engineers, actuarial developers, regulatory compliance experts, and integration architects. Key challenges include federated ML expertise scarcity, regulatory calculation validation complexity, and ongoing maintenance burden. Estimated build cost $2.5-4M excluding opportunity cost of delayed deployment.
Market Alternatives
Guidewire Analytics / Cyence
$500K-1.5M annually depending on scaleStrong choice for Guidewire-centric environments; native integration reduces complexity but limits flexibility for multi-platform estates
- • Native Guidewire integration with minimal custom development
- • Established vendor with insurance domain expertise
- • Limited flexibility for non-Guidewire data sources
- • Regulatory compliance modules may require customization for specific jurisdictions
SAS Insurance Analytics
$400K-1.2M annuallyEnterprise-grade analytics with strong actuarial heritage; suitable for organizations with existing SAS investments
- • Mature actuarial modeling capabilities with regulatory templates
- • Strong governance and audit trail features
- • Steeper learning curve for modern ML techniques
- • Integration with modern cloud-native claims platforms can be complex
Databricks + Partner Solutions
$300K-800K platform cost plus $500K-1M custom developmentFlexible platform approach requiring significant custom development; suitable for organizations with strong internal data engineering capabilities
- • Maximum flexibility for custom requirements
- • Strong ML and data engineering ecosystem
- • Requires substantial internal expertise or consulting investment
- • Regulatory compliance modules must be built or sourced separately
Our Positioning
KlusAI's approach suits organizations requiring cross-platform integration across heterogeneous claims systems, specific regulatory compliance customization for multi-jurisdictional operations, or flexibility to adapt as AI capabilities evolve. We assemble specialized teams combining ML engineering, actuarial domain expertise, and regulatory compliance knowledge tailored to each engagement's specific requirements.
Team Composition
KlusAI assembles specialized teams tailored to each engagement, drawing from our vetted network of professionals with relevant insurance, actuarial, and regulatory technology experience. Team composition scales based on implementation scope and client internal capabilities.
| Role | FTE | Focus |
|---|---|---|
| Engagement Lead / Solutions Architect | 1.0 | Overall delivery accountability, architecture decisions, stakeholder management, and risk mitigation |
| ML Engineering Lead | 1.0 | Forecasting model development, SHAP explainability implementation, and model governance framework |
| Data Integration Engineer | 1.5 | Federated data agent development, semantic mapping, and data quality validation pipelines |
| Actuarial/Regulatory SME | 0.5 | IFRS 17, Solvency II, NAIC RBC calculation validation and regulatory report format compliance |
| DevOps/Platform Engineer | 0.75 | Cloud infrastructure, CI/CD pipelines, observability, and production operations |
Supporting Evidence
Performance Targets
15-25% reduction in MAPE for 12-month reserve forecasts
15-23 days reduction for complex claims assessment
40-60% reduction in manual preparation effort
50-70% reduction in cross-system reconciliation time
Team Qualifications
- KlusAI's network includes professionals with experience in insurance claims analytics, actuarial systems, and regulatory compliance technology implementations
- Our teams are assembled with specific expertise in federated ML architectures, IFRS 17/Solvency II compliance frameworks, and enterprise integration patterns for insurance platforms
- We bring together technical specialists and domain experts tailored to each engagement's regulatory jurisdiction and technology landscape requirements
Source Citations
significant challenges from fragmented claims data across P&C, life, and health systems, hindering timely volume, severity, and reserve forecasts
directionalClaims managers are faced with the unique challenge of anticipating the future based on past events... requires a high level of expertise, especially when managing significant workloads... mining multiple sources of data
directionalPredictive analytics powered by AI tools enables insurers to predict potential costs... analyze vast datasets... from diverse sources
directionalUK insurer Aviva rolled out... cutting liability assessment time for complex cases by 23 days
"cutting liability assessment time for complex cases by 23 days"exact
Ready to discuss?
Let's talk about how this could work for your organization.
Schedule a Consultation
Pick a date that works for you
Times shown in your local timezone ()
Prefer email? Contact us directly
Almost there!
at
Your details
at
You're all set!
Check your email for confirmation and calendar invite.
Your booking is confirmed! Our team will reach out to confirm the details.
Your consultation
· min
( team time)
Quick Overview
- Technology
- Predictive Analytics
- Complexity
- high
- Timeline
- 5-8 months
- Industry
- Finance