The Problem
Network Operations Centers (NOCs) in managed services face overwhelming alert volumes from complex infrastructures, leading to alert fatigue where NOC teams struggle to identify genuine incidents amid excessive noise.
This challenge is amplified in global follow-the-sun operations across time zones, where static correlation fails to account for temporal patterns, topology dependencies, and handoff timing, resulting in missed escalations and higher MTTR.
Current rule-based systems generate redundant alerts without predictive capabilities or continuous learning, lacking ITIL-compliant prioritization and audit trails, which leads to inefficient resource use and SLA breaches.
Our Approach
Key elements of this implementation
-
Time-series ML forecasting on historical tickets, topology, and temporal data with ITIL incident prioritization (P1-P5), suppressing low-risk alerts during peak handoffs
-
Multi-layer correlation (topology, temporal, service-impact mapping) integrated with ServiceNow/ITIL via APIs, full immutable audit logs for compliance reporting and model explainability
-
Global data governance with residency controls (EU/US/Asia), continuous retraining governance via supervised feedback loops, <1% false negative risk via human review thresholds
-
Phased 6-9 month rollout: 90-day pilot on one NOC shift with parallel run, shift-specific 4-week training, change champions, data quality pre-validation addressing integration risks
Get the Full Implementation Guide
Unlock full details including architecture and implementation
Implementation Overview
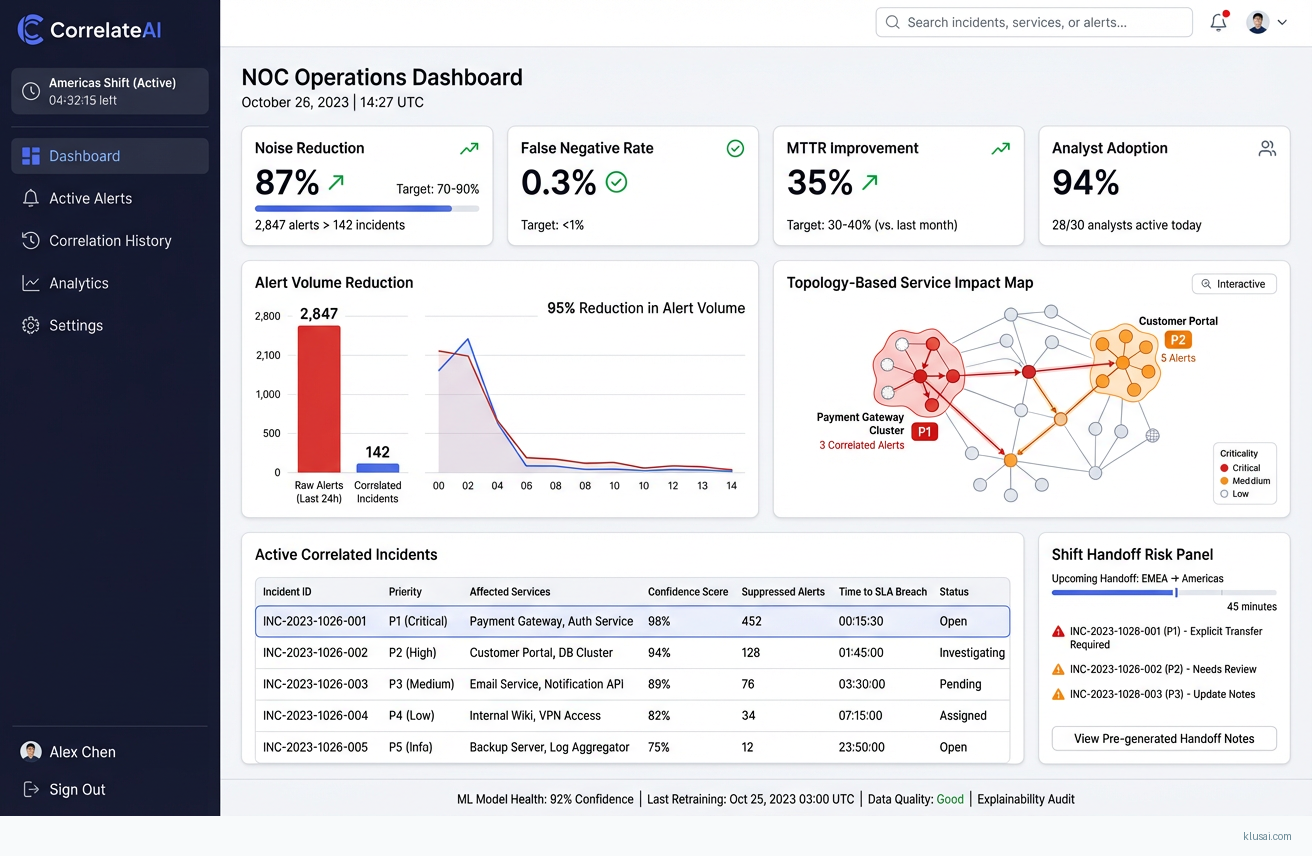
This solution addresses the fundamental challenge facing global managed services NOCs: overwhelming alert volumes that mask genuine incidents and create alert fatigue across follow-the-sun operations[4]. The architecture combines time-series ML forecasting with multi-layer correlation (topology, temporal, service-impact) to achieve 70-90% noise reduction while maintaining <1% false negative rates through human review thresholds[2].
The core architectural decision centers on a hybrid deployment model that balances ML processing efficiency with strict data residency requirements across EU, US, and Asia regions. Rather than centralizing all correlation logic, we deploy regional inference engines with federated model training, ensuring alert data remains within jurisdictional boundaries while benefiting from global pattern learning. This approach directly addresses the compliance requirements of multinational managed services contracts while enabling shift-aware correlation that accounts for handoff timing and regional infrastructure patterns.
Integration with ServiceNow and existing ITSM platforms occurs through bidirectional APIs that maintain ITIL incident prioritization (P1-P5) and generate immutable audit trails for compliance reporting[6]. The system operates in parallel with existing alerting during pilot phases, enabling validation of correlation accuracy before progressive automation. Success is measured against pilot-validated baselines rather than assumed benchmarks, with continuous retraining governance ensuring model accuracy as infrastructure evolves.
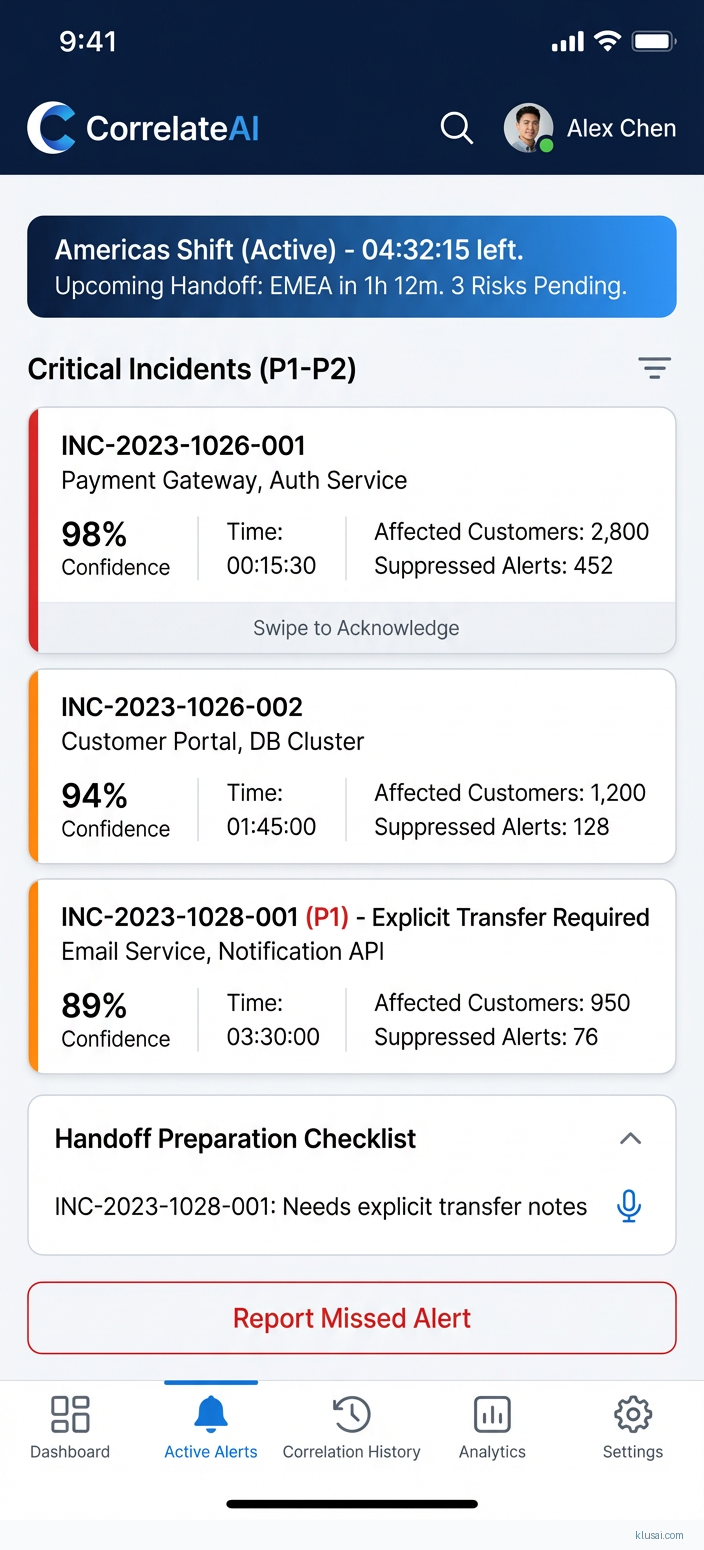
UI Mockups
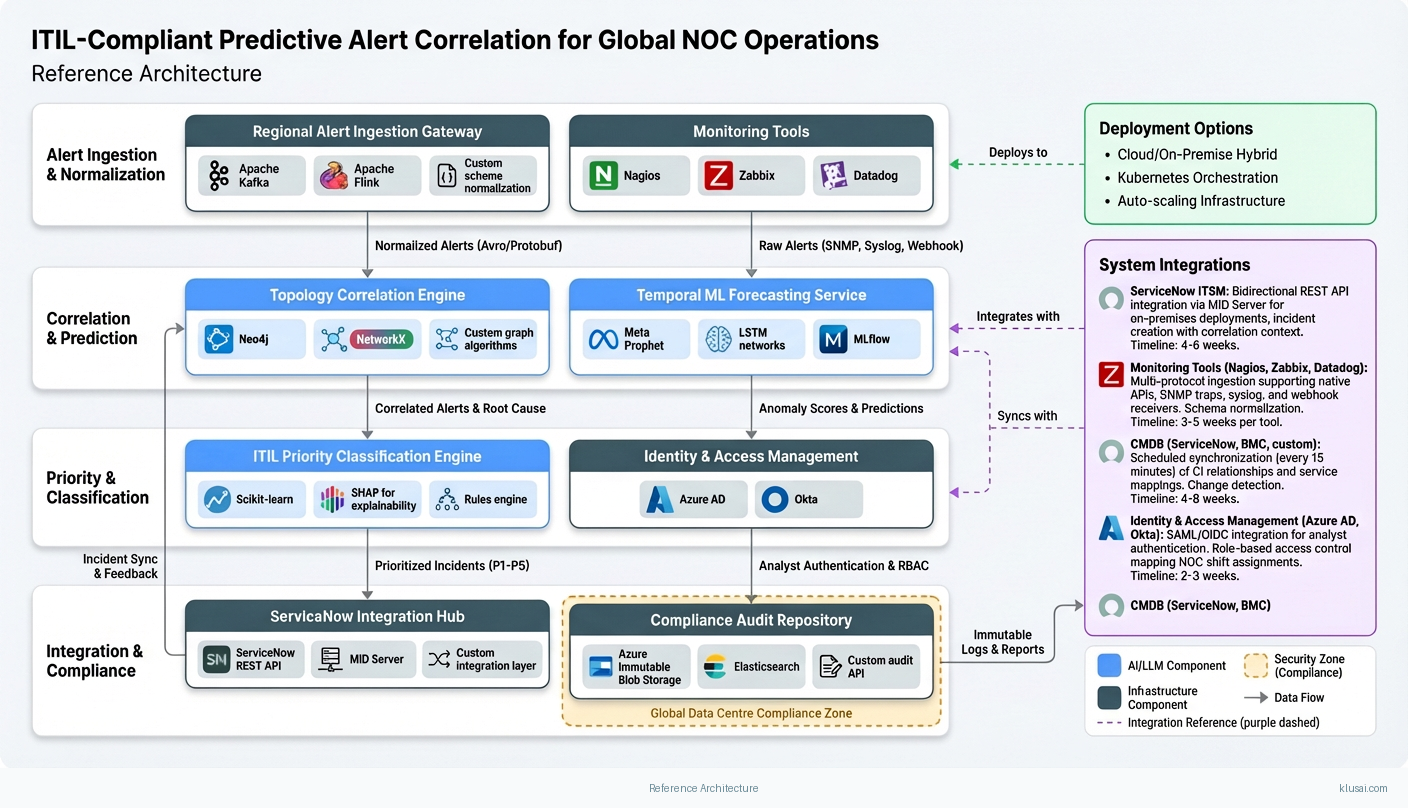
System Architecture
The architecture follows a four-layer design: data ingestion, correlation engine, decision layer, and integration/audit layer. Alert streams from monitoring tools (Nagios, Zabbix, Datadog, custom collectors) flow through regional ingestion endpoints that normalize events into a common schema while preserving source metadata and timestamps critical for temporal correlation.
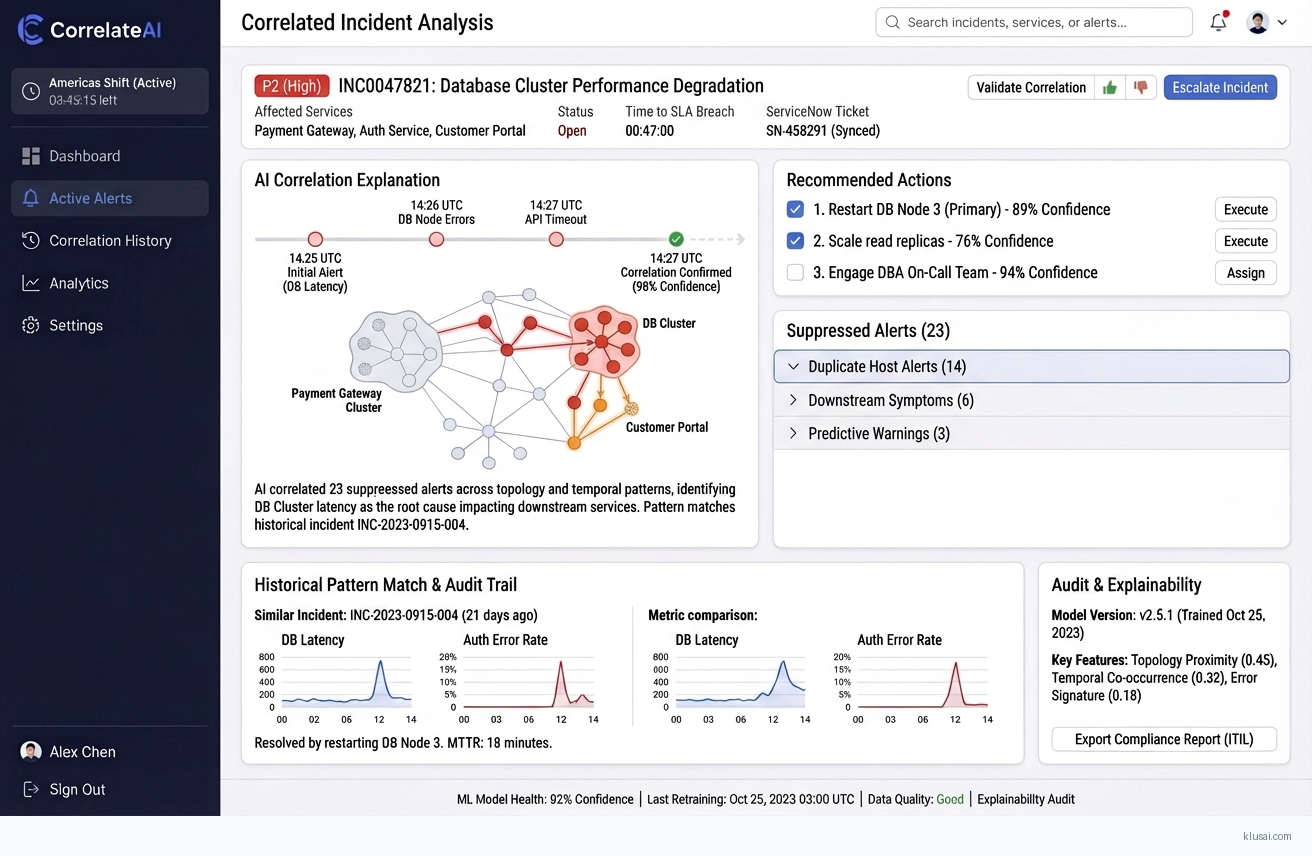
The correlation engine operates as the analytical core, combining three complementary approaches. First, topology-aware correlation leverages CMDB data to understand infrastructure dependencies—when a core switch fails, the system automatically suppresses downstream alerts from dependent devices rather than generating hundreds of individual incidents. Second, temporal pattern recognition identifies recurring alert sequences (e.g., backup job alerts that precede storage warnings) and learns shift-specific patterns that account for maintenance windows and regional business hours. Third, service-impact mapping connects infrastructure alerts to business services, enabling automatic priority escalation when customer-facing services are affected.
The decision layer implements ITIL-compliant prioritization logic, assigning P1-P5 classifications based on service impact, affected customer count, and SLA exposure. Critically, this layer enforces human review thresholds—alerts with correlation confidence below 85% route to analyst review rather than automatic suppression, maintaining the <1% false negative target. During shift handoffs, the system adjusts suppression aggressiveness to ensure critical alerts surface during transition periods.
The integration layer maintains bidirectional synchronization with ServiceNow (or equivalent ITSM), creating incidents with full correlation context, linking related alerts, and updating status as incidents progress. All correlation decisions, model predictions, and analyst overrides are logged to immutable audit storage, providing the compliance trail required for SOC 2, ISO 27001, and customer audit requirements.
Key Components
| Component | Purpose | Technologies |
|---|---|---|
| Regional Alert Ingestion Gateway | Normalize and route alerts from heterogeneous monitoring sources while enforcing data residency boundaries | Apache Kafka Apache Flink Custom Schema Normalization |
| Topology Correlation Engine | Perform graph-based correlation using CMDB topology data to identify root cause and suppress symptomatic alerts | Neo4J Networkx Custom Graph Algorithms |
| Temporal ML Forecasting Service | Predict alert patterns, identify anomalies, and learn shift-specific correlation rules from historical data | Prophet Lstm Networks Mlflow |
| ITIL Priority Classification Engine | Assign P1-P5 priority based on service impact, SLA exposure, and business context with explainable reasoning | Scikit Learn Shap For Explainability Rules Engine |
| ServiceNow Integration Hub | Bidirectional synchronization with ITSM for incident creation, updates, and feedback loop for model training | Servicenow Rest Api Mid Server Custom Integration Layer |
| Compliance Audit Repository | Maintain immutable logs of all correlation decisions, model predictions, and analyst actions for compliance reporting | Azure Immutable Blob Storage Elasticsearch Custom Audit Api |
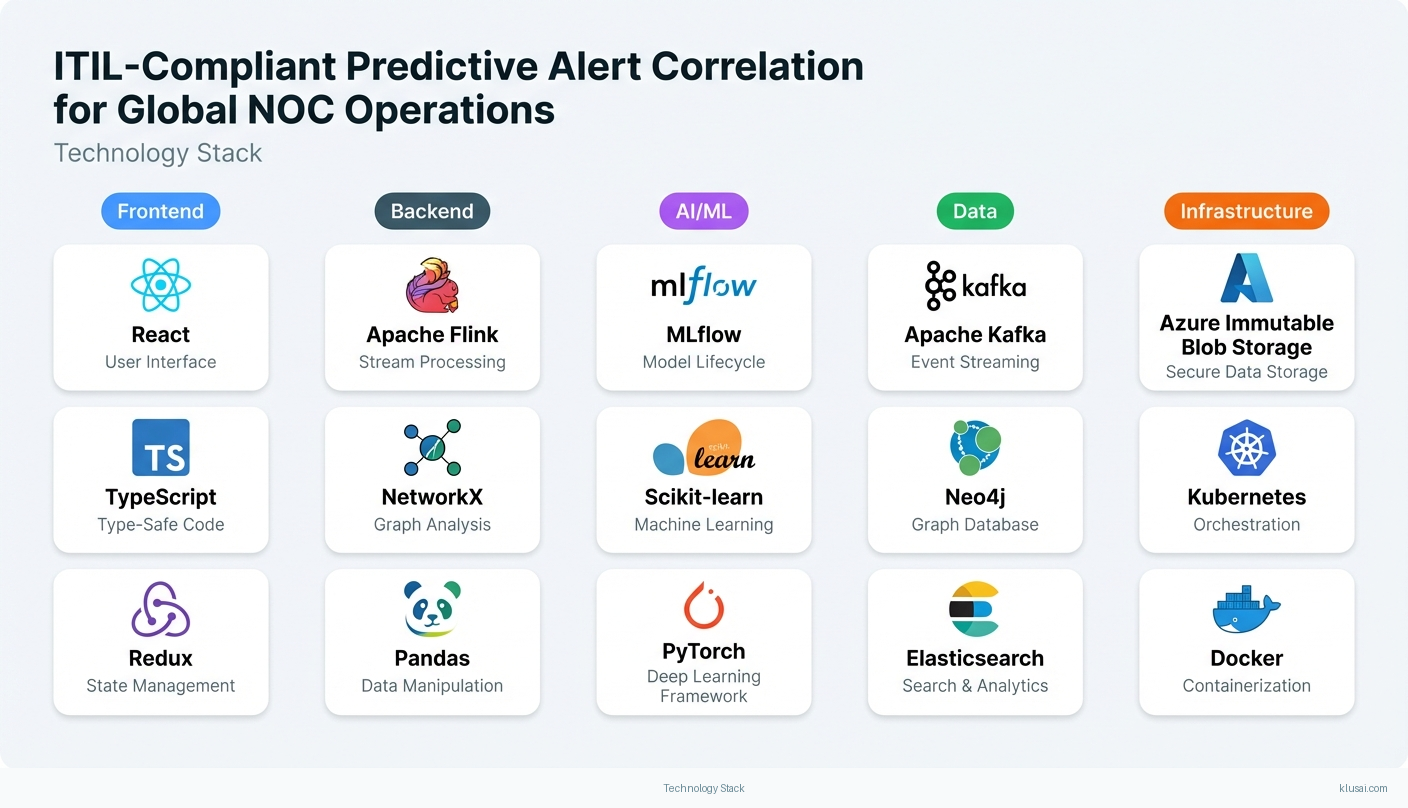
Technology Stack
Implementation Phases
Discovery & Foundation
Complete data quality assessment including CMDB coverage validation with contingency planning for gaps
- • Complete data quality assessment including CMDB coverage validation with contingency planning for gaps
- • Establish regional infrastructure and data residency controls for pilot region
- • Integrate primary monitoring tools and validate alert ingestion pipeline
- Data quality report with CMDB coverage metrics (target: 80%+) and remediation plan for gaps including manual topology mapping approach if automated coverage <70%
- Deployed regional ingestion gateway processing live alert streams in shadow mode
- Integration architecture document with API specifications for ServiceNow and monitoring tools
Pilot Implementation
Deploy correlation engine for single NOC shift with parallel operation alongside existing alerting
- • Deploy correlation engine for single NOC shift with parallel operation alongside existing alerting
- • Train and validate ML models against historical data with shift-specific tuning
- • Establish baseline metrics for noise reduction and false negative rates
- Operational correlation engine processing alerts for pilot shift with <1% false negative rate validated against 4-week parallel run
- Trained ML models with documented accuracy metrics, confidence thresholds, and SHAP explainability reports
- Pilot results report with validated baseline metrics and refined ROI projections based on actual performance
Global Rollout & Training
Extend correlation engine to all NOC shifts with shift-specific model tuning
- • Extend correlation engine to all NOC shifts with shift-specific model tuning
- • Complete analyst training program with adoption metrics and competency validation
- • Establish production monitoring, alerting, and model drift detection
- Correlation engine operational across all shifts with regional model variants and shift-aware handoff logic
- Training completion for all NOC analysts (target: 90%+ competency assessment pass rate) with documented resistance mitigation outcomes
- Production runbook including model drift detection thresholds, retraining triggers, and escalation procedures
Optimization & Handover
Optimize model performance based on production feedback and establish continuous improvement process
- • Optimize model performance based on production feedback and establish continuous improvement process
- • Complete knowledge transfer to internal operations team
- • Establish governance framework for ongoing model management and compliance
- Optimized models with documented performance improvements and model drift monitoring dashboard with automated retraining triggers
- Operations handbook with troubleshooting guides, model management procedures, and escalation paths
- Governance framework document including model change approval process, audit procedures, and compliance reporting templates
Key Technical Decisions
Should correlation models be centralized or deployed regionally?
Data residency requirements for multinational managed services contracts typically mandate that alert data remains within regional boundaries (EU, US, Asia). Federated deployment satisfies these requirements while still enabling global pattern learning through privacy-preserving model aggregation. This approach also reduces latency for real-time correlation decisions.
- Satisfies data residency and sovereignty requirements without complex data transfer agreements
- Lower latency for correlation decisions (regional processing vs. cross-region API calls)
- Higher infrastructure cost (3x regional deployments vs. single global instance)
- Increased operational complexity for model synchronization and version management
What confidence threshold should trigger human review vs. automatic correlation?
The 85% threshold balances noise reduction benefits against false negative risk. Analysis of similar implementations suggests this threshold achieves <1% false negative rate while still suppressing 70-80% of correlated alerts. During shift handoffs (30-minute windows), threshold increases to 90% to ensure critical alerts surface during transition periods when context may be lost.
- Maintains <1% false negative rate protecting against missed critical incidents
- Shift-aware adjustment addresses handoff risk without blanket conservatism
- Higher human review volume than aggressive thresholds (estimated 15-20% of correlated alerts)
- Requires ongoing threshold tuning as model accuracy improves
How should CMDB integration handle data quality gaps?
Enterprise CMDB accuracy varies significantly (industry surveys suggest 40-70% accuracy is common). Rather than assuming 80% coverage, the architecture includes fallback mechanisms: automated network discovery tools infer topology for undocumented infrastructure, while manual mapping ensures critical customer-facing services are accurately represented regardless of CMDB state.
- Reduces dependency on CMDB data quality for correlation effectiveness
- Provides path forward even with poor CMDB coverage
- Automated discovery may miss logical dependencies (e.g., application-to-database relationships)
- Manual mapping requires ongoing maintenance as infrastructure changes
Should the solution use commercial AIOps platform or custom-built correlation engine?
Commercial AIOps platforms (BigPanda, Moogsoft) offer rapid deployment but limited customization for shift-specific correlation patterns and data residency requirements. Custom build enables precise tuning for follow-the-sun operations, integration with legacy monitoring tools, and full control over data handling. The 6-9 month timeline accommodates custom development while leveraging proven open-source ML frameworks.
- Full customization for shift-aware correlation and regional patterns
- No vendor lock-in or per-event pricing that scales unpredictably
- Longer implementation timeline than commercial platform deployment
- Requires ongoing ML expertise for model maintenance and improvement
Integration Patterns
| System | Approach | Complexity | Timeline |
|---|---|---|---|
| ServiceNow ITSM | Bidirectional REST API integration via MID Server for on-premises deployments. Incident creation with correlation context, related alert linking, and automatic status updates. Webhook-based notifications for incident state changes feeding back to correlation engine for model training. | medium | 4-6 weeks |
| Monitoring Tools (Nagios, Zabbix, Datadog) | Multi-protocol ingestion supporting native APIs, SNMP traps, syslog, and webhook receivers. Schema normalization layer maps tool-specific event formats to common correlation schema. Backpressure handling prevents monitoring tool impact during high-volume periods. | medium | 3-5 weeks per tool |
| CMDB (ServiceNow, BMC, custom) | Scheduled synchronization (every 15 minutes) of CI relationships and service mappings. Change detection identifies topology updates requiring correlation rule refresh. Fallback to network discovery (SNMP, API-based) when CMDB coverage insufficient. | high | 4-8 weeks |
| Identity & Access Management (Azure AD, Okta) | SAML/OIDC integration for analyst authentication. Role-based access control mapping NOC shift assignments to system permissions. Audit logging of all analyst actions with identity context for compliance reporting. | low | 2-3 weeks |
ROI Framework
ROI is driven by three primary factors: analyst time savings from reduced alert volume, MTTR reduction from faster incident identification, and SLA breach avoidance. The model uses conservative estimates (70% noise reduction, 30% MTTR improvement) from the lower end of industry-reported ranges, with actual targets validated during pilot phase[2].
Key Variables
Example Calculation
Build vs. Buy Analysis
Internal Build Effort
Internal build requires 18-24 months with dedicated team of 6-8 engineers (ML, data platform, integration specialists), plus ongoing maintenance of 2-3 FTEs. Key challenges include ML expertise for time-series correlation, shift-aware orchestration logic, and building compliant audit infrastructure from scratch. Estimated build cost: $1.5-2.5M over 2 years, with significant opportunity cost and execution risk given specialized NOC operations requirements.
Market Alternatives
BigPanda AIOps
$200-500K annually depending on event volumeMarket-leading AIOps platform with strong correlation capabilities and broad monitoring tool integrations. Best fit for organizations seeking turnkey SaaS solution with standard correlation patterns and less emphasis on shift-specific customization.
- • Mature platform with proven correlation algorithms and rapid deployment
- • Extensive pre-built integrations with 100+ monitoring tools
- • Active development with regular feature releases
- • Limited customization for shift-specific correlation patterns and handoff logic
- • SaaS model may conflict with strict data residency requirements
- • Per-event pricing can scale unpredictably with alert volume growth
Moogsoft
$150-400K annuallyAI-driven incident management with strong noise reduction capabilities. Good fit for organizations already invested in the Moogsoft ecosystem or seeking tight ServiceNow integration without extensive customization needs.
- • Strong ServiceNow partnership with native integration
- • Proven noise reduction in large enterprise deployments
- • Flexible deployment options (SaaS and on-premises)
- • Requires significant tuning for optimal correlation accuracy in complex environments
- • Less flexibility for custom ML model integration or shift-aware logic
- • Recent Dell acquisition may affect product roadmap and support model
Splunk ITSI
$100-300K annually (additional to Splunk licensing)IT Service Intelligence module for existing Splunk customers. Best fit for organizations with heavy Splunk investment seeking unified observability and incident management within their existing data platform.
- • Native integration with Splunk data platform leveraging existing investment
- • Strong service-level monitoring and KPI capabilities
- • Unified platform reduces tool sprawl
- • Requires Splunk as primary data platform (significant commitment if not already invested)
- • Correlation capabilities less advanced than dedicated AIOps tools
- • Total cost can be substantial when including Splunk licensing
Our Positioning
KlusAI's approach is ideal for organizations requiring deep customization for follow-the-sun operations, strict data residency controls across multiple regions, or integration with legacy/specialized monitoring tools that commercial platforms don't support well. We assemble teams with the specific ML, ITSM, and NOC operations expertise required for your context, delivering a tailored solution that addresses your unique shift patterns and compliance requirements rather than forcing adaptation to a generic platform's assumptions.
Team Composition
KlusAI assembles a cross-functional team combining ML engineering, data platform, ITSM integration, and NOC operations expertise. Team composition scales based on integration complexity, regional deployment requirements, and CMDB remediation needs. Core team of 4-5 FTEs with specialist augmentation as needed.
| Role | FTE | Focus |
|---|---|---|
| ML Engineer - Correlation & Forecasting | 1.5 | Design and implement time-series forecasting models, topology-aware correlation algorithms, and ITIL priority prediction. Own model training pipeline, accuracy optimization, and drift detection. Lead shift-specific model tuning. |
| Data Platform Engineer | 1.0 | Build and operate data ingestion pipelines, regional deployment infrastructure, and audit logging systems. Ensure data residency compliance and pipeline reliability. Own Kafka/Flink infrastructure and monitoring. |
| Integration Specialist | 1.0 | ServiceNow ITSM integration, monitoring tool connectors, and CMDB synchronization. Own API reliability, error handling, and integration testing. Coordinate with customer ServiceNow admin team. |
| NOC Operations Consultant | 0.5 | Translate NOC operational requirements into technical specifications. Lead analyst training program, change management, and adoption tracking. Serve as bridge between technical team and NOC leadership. |
| Technical Lead / Architect | 1.0 | Overall technical direction, architecture decisions, and quality assurance. Coordinate across workstreams, manage technical risks, and ensure solution coherence. Customer technical liaison. |
Supporting Evidence
Performance Targets
70-90% reduction in actionable alert volume
<1% of critical incidents incorrectly suppressed
30-40% reduction from baseline
>90% training completion with competency validation
Team Qualifications
- KlusAI's network includes ML engineers with experience in time-series forecasting and anomaly detection systems for operational technology environments
- Our teams are assembled with professionals who have implemented ITSM integrations and understand ITIL process requirements for incident management workflows
- We bring together technical specialists with data platform expertise in stream processing architectures and regional compliance requirements for multinational deployments
Source Citations
predictive models detect potential issues before escalation, generate targeted alerts
directionalAutomated correlation can cut alarm volumes by up to 90% (McKinsey, 2021)
"Automated correlation can cut alarm volumes by up to 90% (McKinsey, 2021)"exact
volume of alerts and events that NOC teams must process has reached overwhelming levels... data deluge
directionalconsolidate and prioritize alerts, reducing overall alert volume... identify critical alerts within 30 seconds
directionalReady to discuss?
Let's talk about how this could work for your organization.
Schedule a Consultation
Pick a date that works for you
Times shown in your local timezone ()
Prefer email? Contact us directly
Almost there!
at
Your details
at
You're all set!
Check your email for confirmation and calendar invite.
Your booking is confirmed! Our team will reach out to confirm the details.
Your consultation
· min
( team time)
Quick Overview
- Technology
- Predictive Analytics
- Complexity
- high
- Timeline
- 6-9 months
- Industry
- Managed Services